Compute > System Monitoring > Advanced Monitoring(OpenMetrics) > Overview
The Advanced Monitoring(OpenMetrics) service is an extension monitoring tool that allows users to monitor various platforms and applications running on their instances. Other than basic system metrics, there are also other ways to collect different metrics for users' varied situation.
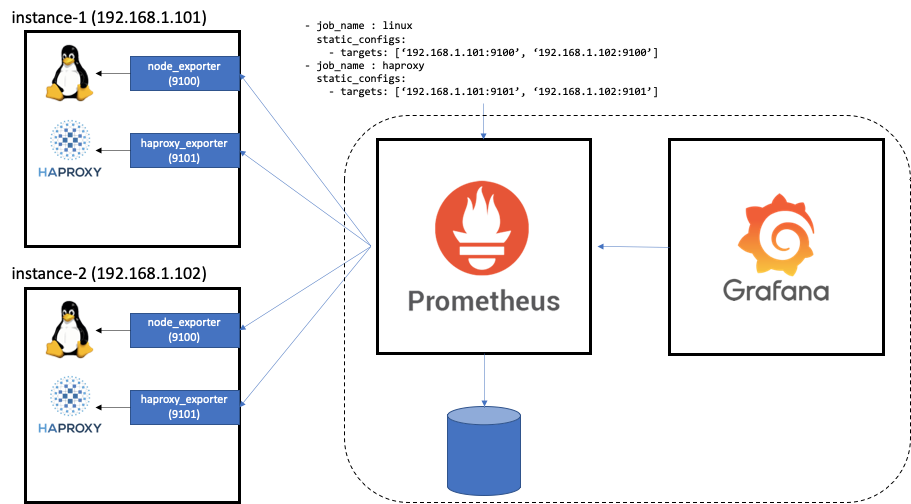
Introducing Prometheus
- As one of the CNCF(Cloud Native Computing Foundation) projects, Prometheus is a tool used to monitor system and service.
- If you specify the monitoring target as HTTP URL in Prometheus, Prometheus sends a request via that path and collect monitoring information based on the response value.
- Using the following methods, you can collect metrics data in Prometheus description format.
- Install the metrics extraction tool (Exporter) or use its own tool provided by the system or platform
- Export metrics you want by directly writing a program that outputs metrics according to the format
Introducing OpenMetrics
- OpenMetrics is a standardization project driven to be used by Prometheus description format and integrated systems based on the format.
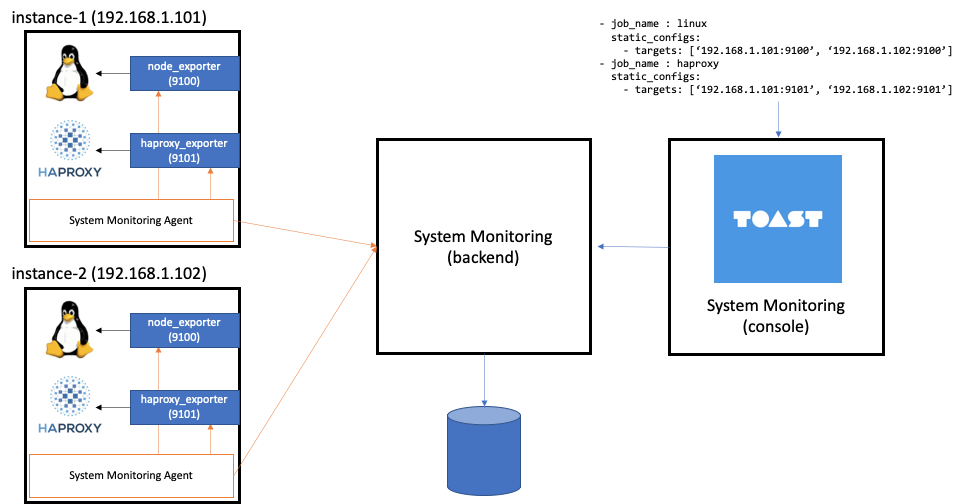
- System Monitoring also provides an OpenMetrics-based monitoring tool.
- Generally, additional consumption of resources and network configuration management are necessary to build Prometheus and monitor it.
- In System Monitoring, as long as there is a path to extract metrics within each instance, the agent will collect metrics instead of users, and users can use the monitoring tool without building a separate service.
Functions Provided
OpenMetrics-based custom metrics collection and dashboard function provided
By installing and running the Exporter of the target system to be monitored by the server instance created in Compute > Instance, the metrics information of the system can be collected. Once the Exporter is ready, through the System Monitoring service, the monitoring function can be enabled and the collected metrics can be viewed. Just like system metrics, you can generate a chart and use a layout you want as well as generating and managing multiple layouts as intended. Also, similar to the default monitoring of the server, by specifying observation target metrics and thresholds, you can detect abnormal signs of the service. In the case of a situation where the set monitoring condition has been met, you can deliver a message to users via email or SMS.
Metrics Collection Cycle And Retention Period
Metrics are collected every minute and retained for up to 5 years. Aggregate metrics data is calculated in unit of 5 minutes, 30 minutes, 2 hours, or 1 day. The guaranteed retention period per aggregate unit is as follows:
| Aggregate Unit | Retention Period |
|---|---|
| 1 min | 1 yr |
The max retention period is subject to change depending on the situation, and if it is changed, members will be notified separately.